How we compared retirement calculators
A retirement calculator should do more than produce a single age or percentage. It should show which inputs drive the result, make uncertainty visible, and let you test decisions without rebuilding the plan from scratch.
We looked at scenario flexibility, investment assumptions, retirement income, tax awareness, usability, pricing, and the incentives behind each product. No one category determines the winner.
- Transparent inputs and editable assumptions
- Support for pensions and Social Security timing
- Flexible spending phases and one-time expenses
- Clear explanations of probability and risk
Important A planning result is an estimate, not a promise. Use ranges and repeat the calculation when your income, spending, assets, or goals materially change.
Five tools, five different strengths
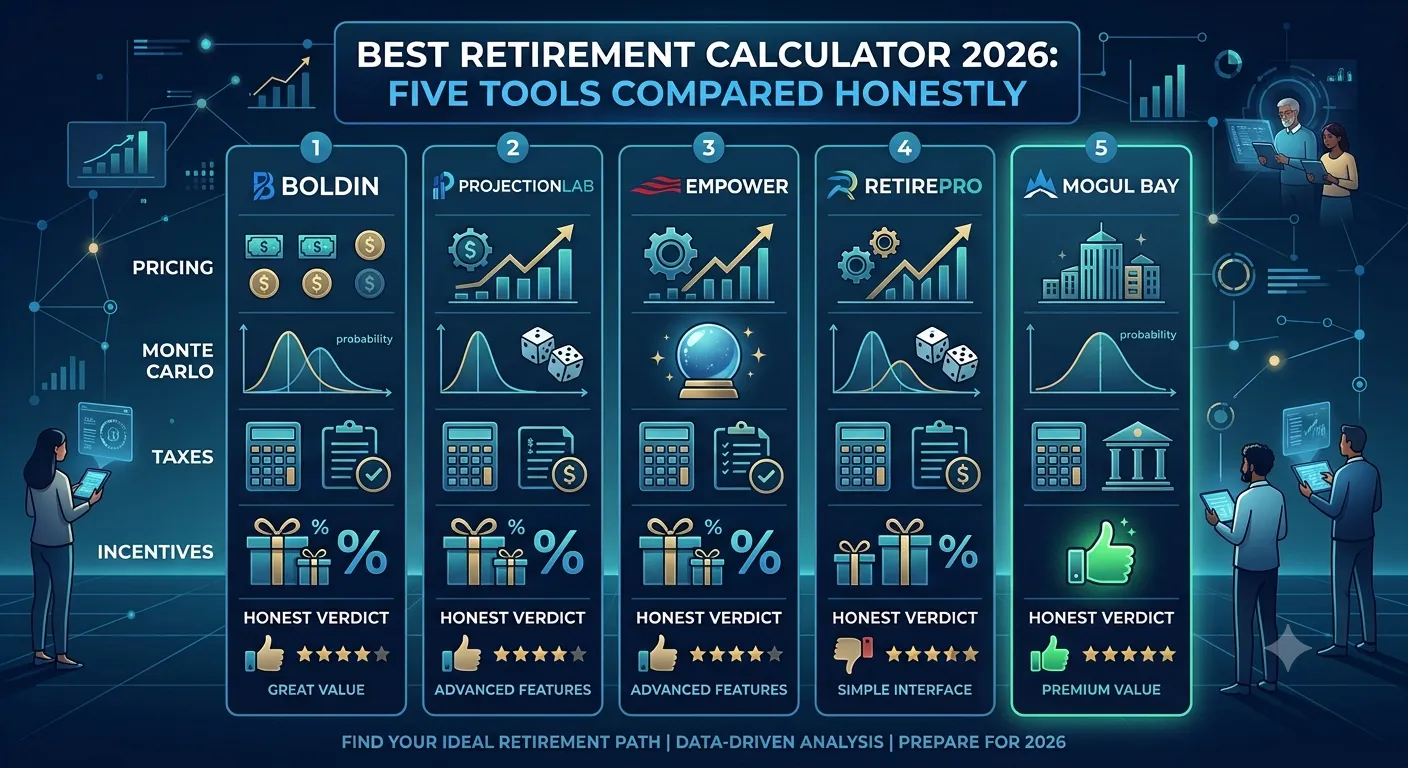
Boldin offers a broad retirement-planning toolkit. ProjectionLab emphasizes visual timelines and scenario comparison. Empower is strongest when account aggregation and access to advisory services are priorities. RetirePro supports deeper analytical work, while Mogul Bay connects net worth tracking with future-wealth projections and decision context.
The best choice depends on how much detail you can maintain. A sophisticated model that is never updated can be less useful than a simpler plan you revisit every quarter.
| Tool | Notable strength | Good fit for |
|---|---|---|
| Boldin | Broad planning workflow | Hands-on retirement planners |
| ProjectionLab | Visual scenario timelines | People comparing life paths |
| Empower | Account aggregation | Users who want a consolidated view |
| RetirePro | Detailed analysis | Advanced planning work |
| Mogul Bay | Net worth plus future context | Clear, ongoing trajectory tracking |
What Monte Carlo results do — and do not — tell you
Monte Carlo analysis runs many possible market paths to show how often a plan meets its stated goal under a particular set of assumptions. It can reveal fragility, but the percentage is not a personal guarantee.
Pay attention to what the model assumes about returns, inflation, fees, spending flexibility, and the order of market outcomes. Two calculators can show different probabilities while both are working as designed.
Read the result carefully A lower probability may point to a useful planning conversation: retire later, save more, reduce fixed spending, or create a flexible response to weak markets.
Which calculator should you choose?
Choose based on the questions you need to revisit. If visual scenario comparison keeps you engaged, prioritize that. If taxes, pensions, or withdrawal sequencing dominate your plan, choose a tool that exposes those inputs clearly.
Most importantly, compare the calculator's output with your own expectations. When the answer surprises you, investigate the assumption before acting on the result.